US 10-Year Yield ETF (IEF)
By Thu, May 20, 2021
Lately we’ve been in more of a defensive trading mode.
As we’ve seen fewer higher highs in the market, we’ve been raising cash, shorting stocks, and buying gold.
That’s worked out well so far, so we’re leaning into it.
Today’s Chart of the Week is buying US Treasury Bonds.
Specifically, we’re buying the Benchmark US 10-Year Yield ETF (IEF).
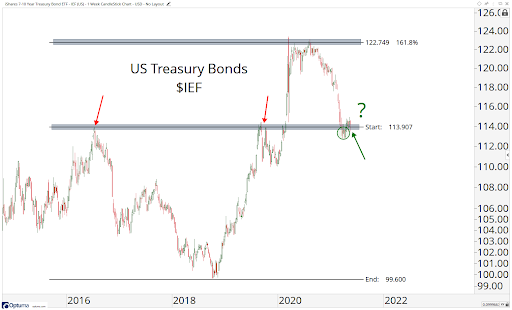
This is strategic portfolio positioning, so we are long above 114. Below that, we may be early, or even wrong. So we want to protect against that by confirming our assumption and waiting for the 114 level.
Below that we are just watching, but once we hit 114, we’re in it long with a target of 119/120.
Now, that may not seem like much, but if the market is falling, any gains are good gains.
Til next week, good trading,

JC Parets
Sponsored Ad
Free Training: 60-Minutes to Trading Freedom
Would you like to make more money in one hour of fun trading than working all day at a job?
Then check this out…
About the Author
JC Parets, founder of All Star Charts, specializes in finding the most opportunistic risk vs. reward propositions while at the same time bringing a top/down approach to the marketplace whose wide spectrum is rivaled by few. JC begins with a long-term global macro perspective and then works his way down to the individual sector and industry level before ultimately isolating the stocks that best portray a particular thesis. Price is the most important technical indicator, but JC uses supplements such as Momentum, Relative Strength, and Fibonacci analysis to complete the process.