
Ooma, Inc. (OOMA)
By Wed, Jun 16, 2021
Sometimes all it takes for a stock to take off is a headline.
Just look at AMC and GME, right?
But the right attention, combined with winning technicals, adds up to big potential wins.
That’s why today’s Chart of the Week is so strong in my opinion.
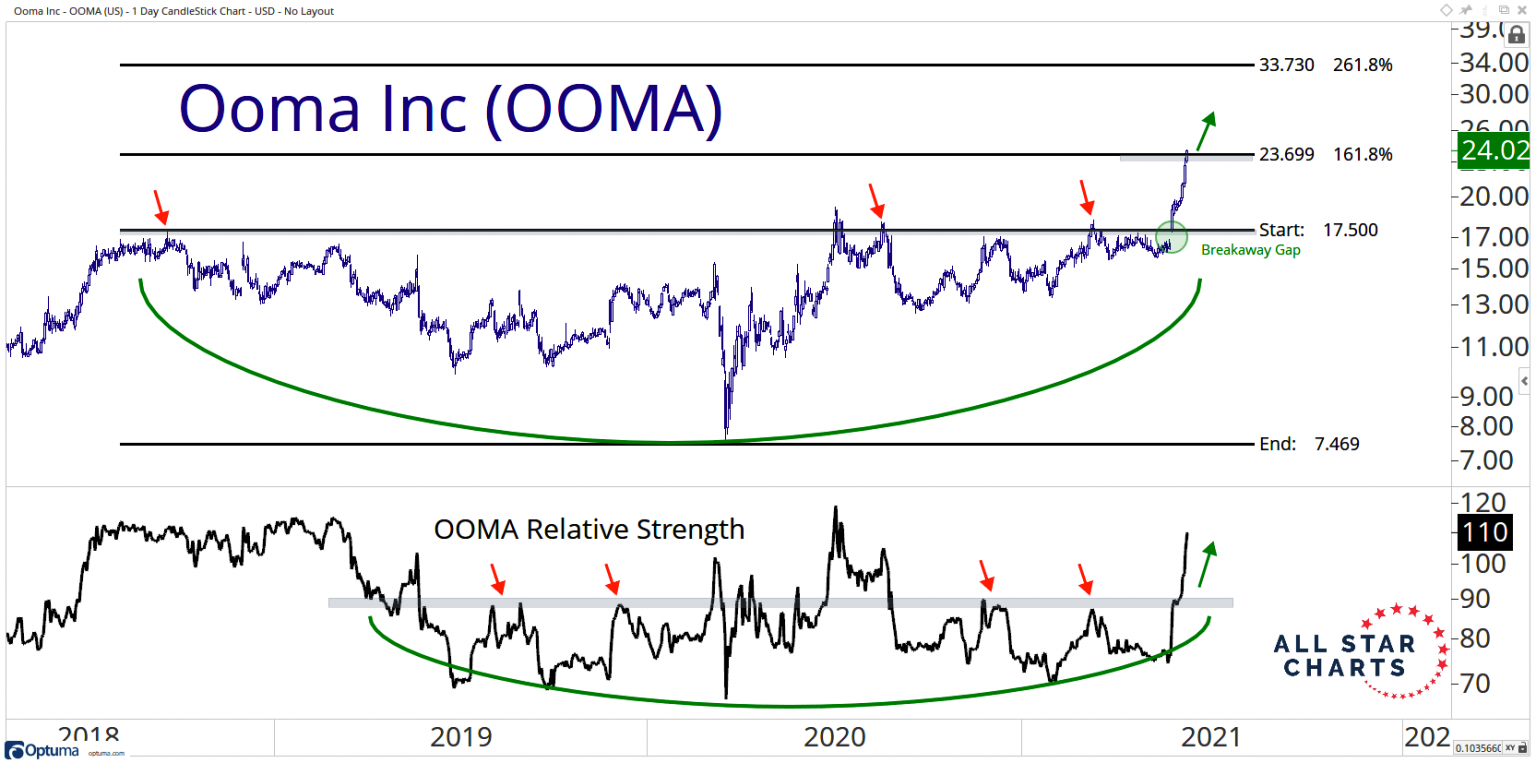
Ooma, Inc. (OOMA), a midcap telecommunications stock, is showing tantalizing relative strength, and looking to break out to the upside as soon as it breaks through the 24 level.
For those who may not know, this report collects millions of data points from dozens of financial sources to identify significant increases in investor attention.
Between that increase in attention and that strong level and relative strength, we are long in OOMA above 24, with a price target of 33.
Below that level, there’s no breakout, but at 24 we are riding it to 33 for a 33% gain.
Great reward, low risk. Just we like it.
Til next week, good trading,

JC Parets
Sponsored Ad
Free Training: 60-Minutes to Trading Freedom
Would you like to make more money in one hour of fun trading than working all day at a job?
Then check this out…
About the Author
JC Parets, founder of All Star Charts, specializes in finding the most opportunistic risk vs. reward propositions while at the same time bringing a top/down approach to the marketplace whose wide spectrum is rivaled by few. JC begins with a long-term global macro perspective and then works his way down to the individual sector and industry level before ultimately isolating the stocks that best portray a particular thesis. Price is the most important technical indicator, but JC uses supplements such as Momentum, Relative Strength, and Fibonacci analysis to complete the process.