Occidental Petroleum (OXY)
By Thu, Oct 7, 2021
We’re back with another electric trade, this time from the energy sector!
Commodities get stronger as inflation goes high, and right now inflation is roaring.
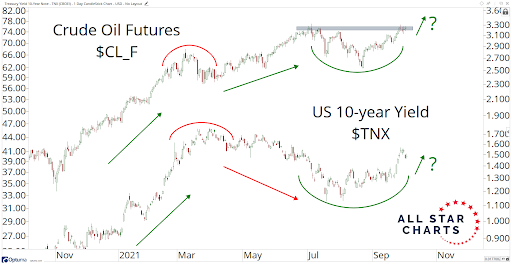
The CRB (commodities) Index is at 6-year highs, as is crude oil.
Energy stocks are hot right now, so it makes sense that today’s Chart of the Week is Occidental Petroleum (OXY).
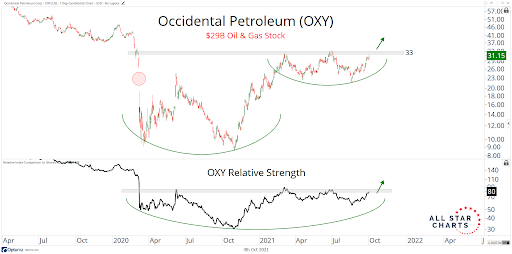
Once we break out of that gorgeous base and go above that 33 level, we are long with a price target of $47.
For anyone looking for another way to play this trade, you can also look at OXY warrants (like options) that expire in 2027.
Or look at the commodity itself, crude oil.
If you’re a futures trader, look at crude oil futures (CL).
We can execute this trade in a variety of ways, depending on your objective, but it’s always about analyzing the underlying asset.
In this case, we’re keeping an eye on crude and targeting our exit in OXY at $47 or whenever crude gets to $100, whichever comes first (both will likely happen at the same time).
Til next week, good trading,

JC Parets
Sponsored Ad
Free Training: 60-Minutes to Trading Freedom
Would you like to make more money in one hour of fun trading than working all day at a job?
Then check this out…
About the Author
JC Parets, founder of All Star Charts, specializes in finding the most opportunistic risk vs. reward propositions while at the same time bringing a top/down approach to the marketplace whose wide spectrum is rivaled by few. JC begins with a long-term global macro perspective and then works his way down to the individual sector and industry level before ultimately isolating the stocks that best portray a particular thesis. Price is the most important technical indicator, but JC uses supplements such as Momentum, Relative Strength, and Fibonacci analysis to complete the process.