Unity Software (U)
By Thu, Nov 25, 2021
The holidays are officially upon us!
Our gift to you is another winning Chart of the Week — with two ways to trade it!
If Unity Software (U) sounds familiar, it’s because we rode it to healthy profits back in September — and this time around, we like it even more!
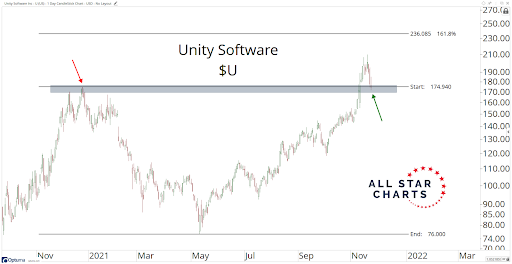
Unity is the industry leader in a very hot space right now, with roughly 70% of the world’s mobile games built on its platform.
It’s a strong stock in a strong industry, trading just off record highs on both absolute and relative terms. There’s a lot to like here.
We’ve been watching Unity hoping for a pullback to the $175 level, which is exactly what happened.
This is an almost perfect entry point, right back to previous highs from December of last year.
That resistance should and could turn into support, and it has.
Now overhead supply is turning into demand, and we’re riding it for a nice gain with a price target of $232.
Trade #2: The options play.
We like buying a $U February 200/250 Bull Call Spread for around a $10.00 debit. This means you’d be long the 200 calls and short an equal amount of 250 calls. And this net debit represents the most you can possibly lose if we’re dead wrong.
We’ll be looking to sell the spread for a profit and collect a $30 credit for the entire spread. That would 3X our money and represent a capture of half of the maximum possible profit available in this trade without having to hold it all the way into February expiration.
That’s a good tradeoff in my book.
Til next week, good trading,

JC Parets
Sponsored Ad
Free Training: 60-Minutes to Trading Freedom
Would you like to make more money in one hour of fun trading than working all day at a job?
Then check this out…
About the Author
JC Parets, founder of All Star Charts, specializes in finding the most opportunistic risk vs. reward propositions while at the same time bringing a top/down approach to the marketplace whose wide spectrum is rivaled by few. JC begins with a long-term global macro perspective and then works his way down to the individual sector and industry level before ultimately isolating the stocks that best portray a particular thesis. Price is the most important technical indicator, but JC uses supplements such as Momentum, Relative Strength, and Fibonacci analysis to complete the process.