
Amazon (AMZN)
By Wed, Aug 19, 2020
Hello,
Today’s Chart of the Week has to be Amazon (AMZN).
Just take a look at this chart.
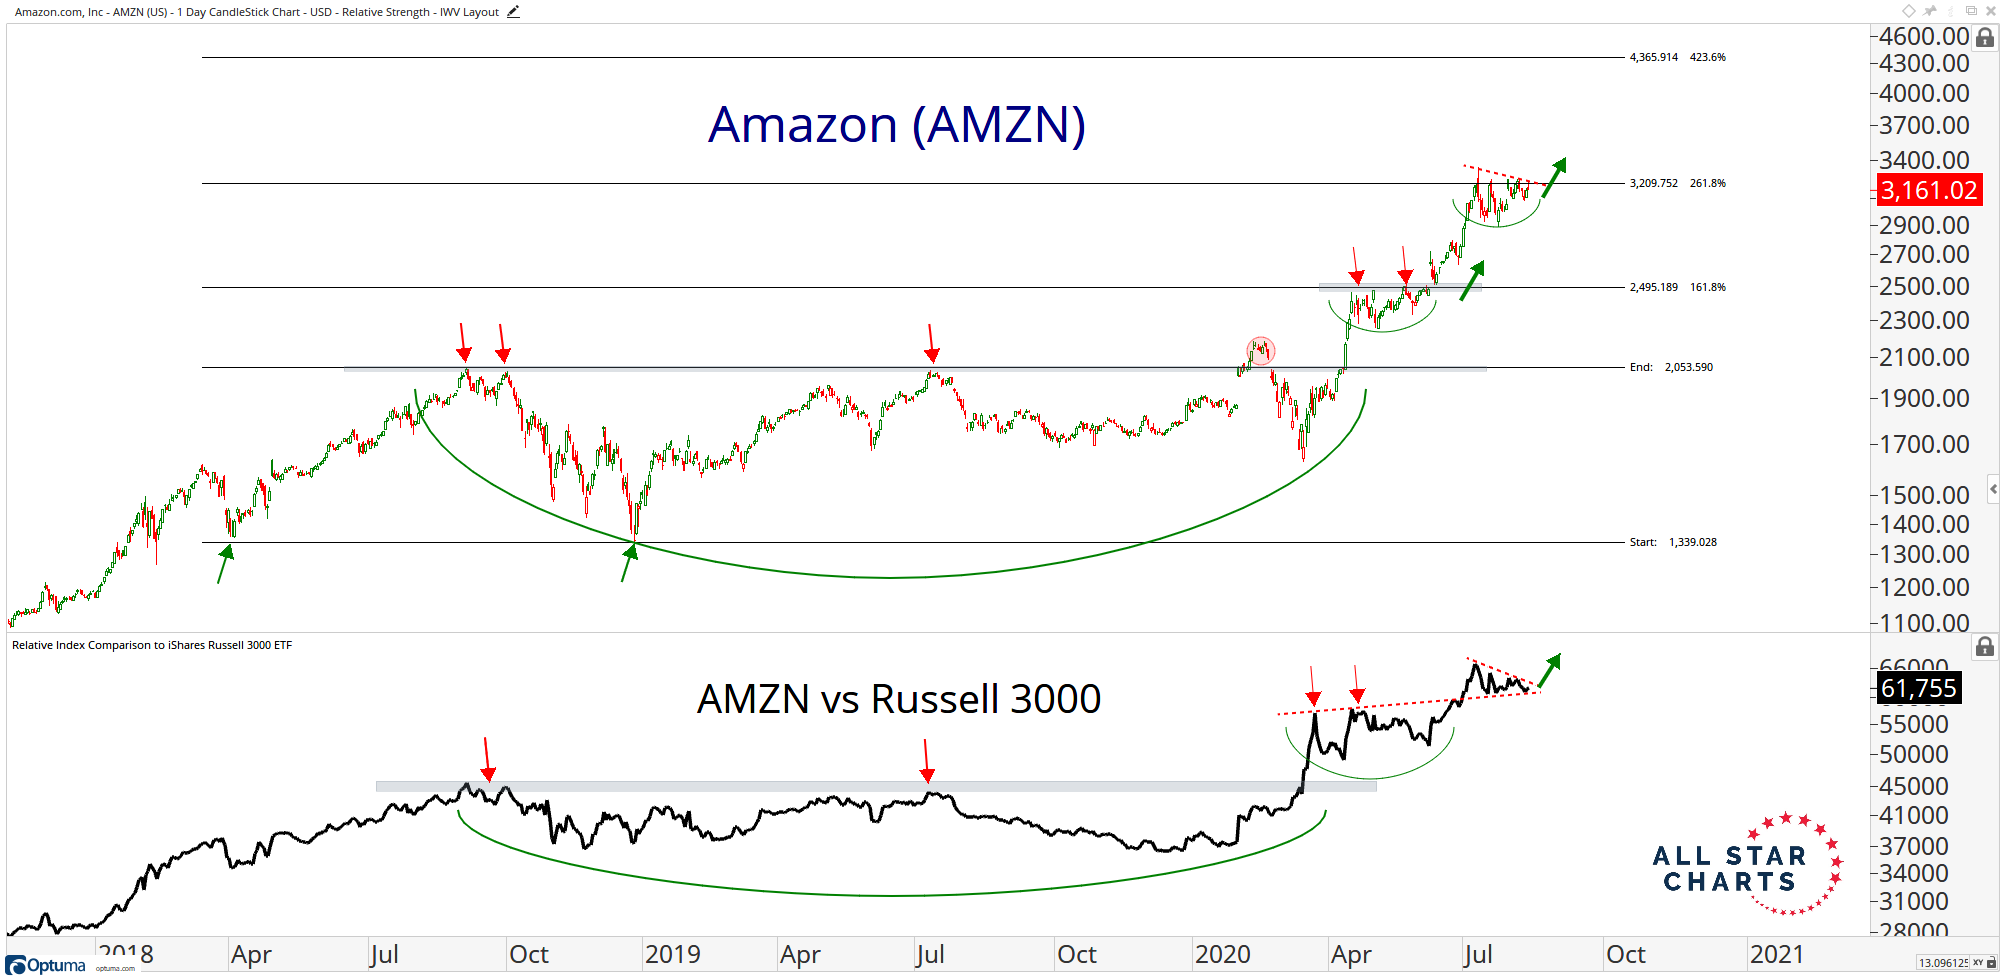
Amazon is breaking out on a relative and absolute basis, and looks ready to rip!
Amazon is not just participating in the trend, it’s leading it.
Consolidations tend to resolve in the direction of the trend, and AMZN has most definitely been in an uptrend.
The level we’re looking at here is $3,200. If we’re above $3,200, we are long in AMZN with a price target of $4,300.
That’s over a thousand points of upside.
Gotta love that risk reward ratio.
Til next time, good trading,

JC Parets
Sponsored Ad
Up to 100,000 companies now using “6G”?

Jeff Brown has made some incredible revelations before…
The angel investor predicted the top tech stock on the S&P 500 in three of the last four years…
He unveiled the key piece inside Apple’s new iPhone – on stage in New Haven, CT – months before the phone has even hit the market.,000 folks into new millionaires. Do nothing and you could be left behind.” —T
In this video, I’m going to give you the name of this company for free – including the stock symbol.
About the Author
JC Parets, founder of All Star Charts, specializes in finding the most opportunistic risk vs. reward propositions while at the same time bringing a top/down approach to the marketplace whose wide spectrum is rivaled by few. JC begins with a long-term global macro perspective and then works his way down to the individual sector and industry level before ultimately isolating the stocks that best portray a particular thesis. Price is the most important technical indicator, but JC uses supplements such as Momentum, Relative Strength, and Fibonacci analysis to complete the process.