
Alibaba Group (BABA)
By Tue, Mar 3, 2020
Hey everyone,
What. A. WEEK.
It’s been quite a ride for traders who were worried about the bottom falling out of the market.
If you’ve been following along with our chart of the week emails, you probably loved it.
Our bond trades couldn’t have worked out any better, and shorting the Russell 2000 small caps worked out great for us as those stocks got crushed.
It was actually one of the single best weeks in our firm’s history — so much so that the Wall Street Journal did a spotlight piece on us.
But last week is in the past.
It’s time to look ahead, and this week we’re back to buying stocks instead of selling off.
Now, this one may surprise you, but we’re looking at China.
Chinese internet in particular.
I know the Coronavirus may be interfering with a lot of industries, but trust me, there’s a lot to like about this week’s trade idea, Alibaba (BABA).
A few things to note…
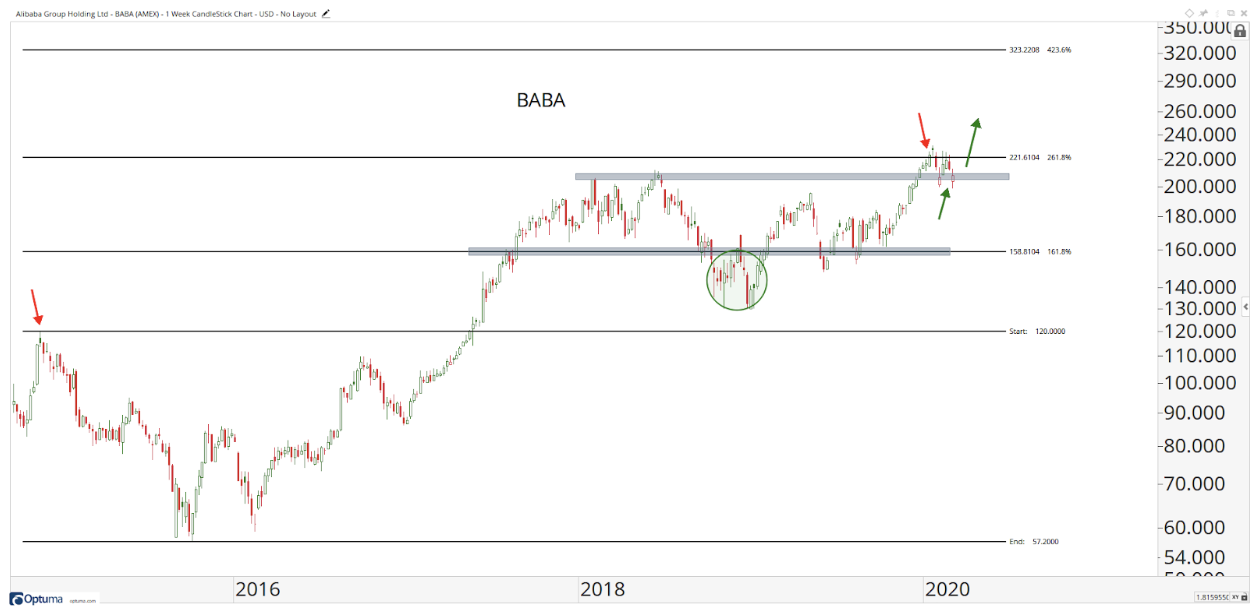
First, look at the chart above — BABA has been steadily rising for the last 4 years. There was some consolidation towards the end of last year that broke through that 208 resistance. Now we’re testing that level as a support.
Second, we have to wonder, why are emerging markets — specifically China and Hong Kong — outperforming the market?
It’s time to participate in that opportunity (while limiting risk)
So for Alibaba (BABA), we are LONG above 208.
If it falls through that support level, we want nothing to do with it below 208.
Just too much risk there.
BUT, if it bounces up, we’re long and strong above 208 with a target of 323 that’s more than 50% gain with extremely minimal risk.
Keep an eye on this one, it should do really well regardless of virus scares.
Good trading,

JC Parets
About the Author
JC Parets, founder of All Star Charts, specializes in finding the most opportunistic risk vs. reward propositions while at the same time bringing a top/down approach to the marketplace whose wide spectrum is rivaled by few. JC begins with a long-term global macro perspective and then works his way down to the individual sector and industry level before ultimately isolating the stocks that best portray a particular thesis. Price is the most important technical indicator, but JC uses supplements such as Momentum, Relative Strength, and Fibonacci analysis to complete the process.