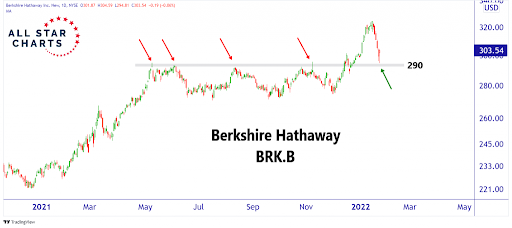
Berkshire Hathaway (BRK.B)
By Thu, Jan 27, 2022
Markets are volatile, which gives us an opportunity to fade the VIX and buy some strong stocks at a discount.
That’s where today’s Chart of the Week comes in: Berkshire Hathaway (BRK.B).
Investing in Warren Buffett is always a good idea.
BRK.B has been a leader in the market for years, and now we get to buy it on sale.
We are long in BRK.B above 300, with a target of 350 – which would be new all-time highs.
This is a great risk to reward ratio for us, but if that’s not enough for you, here’s an options play as well.
We can sell $BRK/B March 280 Puts naked for a $4.50 credit or better.
The level we’ll be watching for an exit is $290. If we see $BRK/B close below $290 at any time during our hold, that will be our signal to close on the next trading day.
But this is a high probability trade selling puts naked as long as BRK.B is above $290.
When in doubt, put your money with Uncle Warren.
Til next week, good trading,

JC Parets
Sponsored Ad
Free Training: 60-Minutes to Trading Freedom
Would you like to make more money in one hour of fun trading than working all day at a job?
Then check this out…
About the Author
JC Parets, founder of All Star Charts, specializes in finding the most opportunistic risk vs. reward propositions while at the same time bringing a top/down approach to the marketplace whose wide spectrum is rivaled by few. JC begins with a long-term global macro perspective and then works his way down to the individual sector and industry level before ultimately isolating the stocks that best portray a particular thesis. Price is the most important technical indicator, but JC uses supplements such as Momentum, Relative Strength, and Fibonacci analysis to complete the process.