
Zoom Video (ZM)
By Tue, Jul 7, 2020
Hey there,
I hope everyone enjoyed their holiday weekend!
My wife and I had a low key 4th and enjoyed some fireworks.
Now we’re seeing more fireworks in the market with today’s Chart of the Week, Zoom Video.
That’s ZM to be clear, not to be confused with that other stock symbol.
ZM is a homerun.
We’ve been watching this since March when we released our coronavirus index.
Zoom Video was top of the list.
Since then, we’ve raised our price target THREE times, and every single time ZM has blown past it.
And we continue to like it.
ZM still shows up on all of our scans.
In fact, the communications index as a group is breaking out on an absolute and relative basis.
So today, we’re back with a 4th favorable risk to reward ratio in ZM.
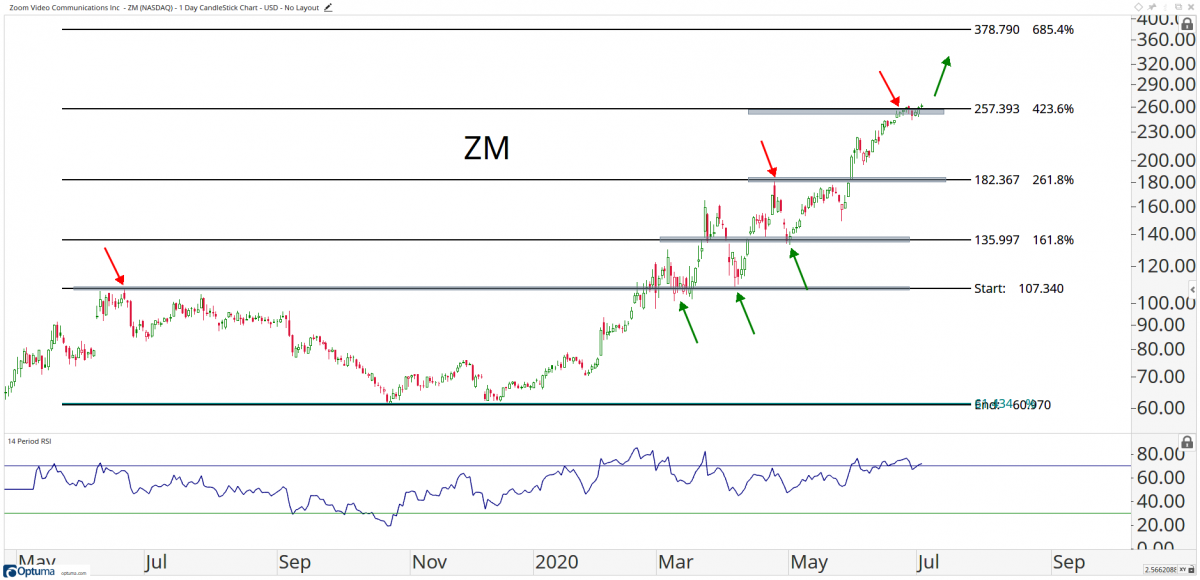
For the next leg, this is a perfectly logical place to start.
We’re only long in zoom AT THIS POINT if it is above $257.
Below $257, don’t take new positions.
But if it’s above, we’re looking at potentially another 50%+ trade with a target of $378.
That’s it for this week.
Til next time, good trading,

JC Parets
P.S. Did you grab your free Technical Analysis training module yet? Click here to get your free access now
Sponsored Ad
Make your first $1000 with this options strategy
Best selling author and founder of Diversified Trading Institute just put the finishing touches on his new ebook.
But why should you care?
Because he has decided to give it away, completely FREE for a limited time.
About the Author
JC Parets, founder of All Star Charts, specializes in finding the most opportunistic risk vs. reward propositions while at the same time bringing a top/down approach to the marketplace whose wide spectrum is rivaled by few. JC begins with a long-term global macro perspective and then works his way down to the individual sector and industry level before ultimately isolating the stocks that best portray a particular thesis. Price is the most important technical indicator, but JC uses supplements such as Momentum, Relative Strength, and Fibonacci analysis to complete the process.