
Stock Chart Sell Signal On $WSM
By Fri, May 29, 2020
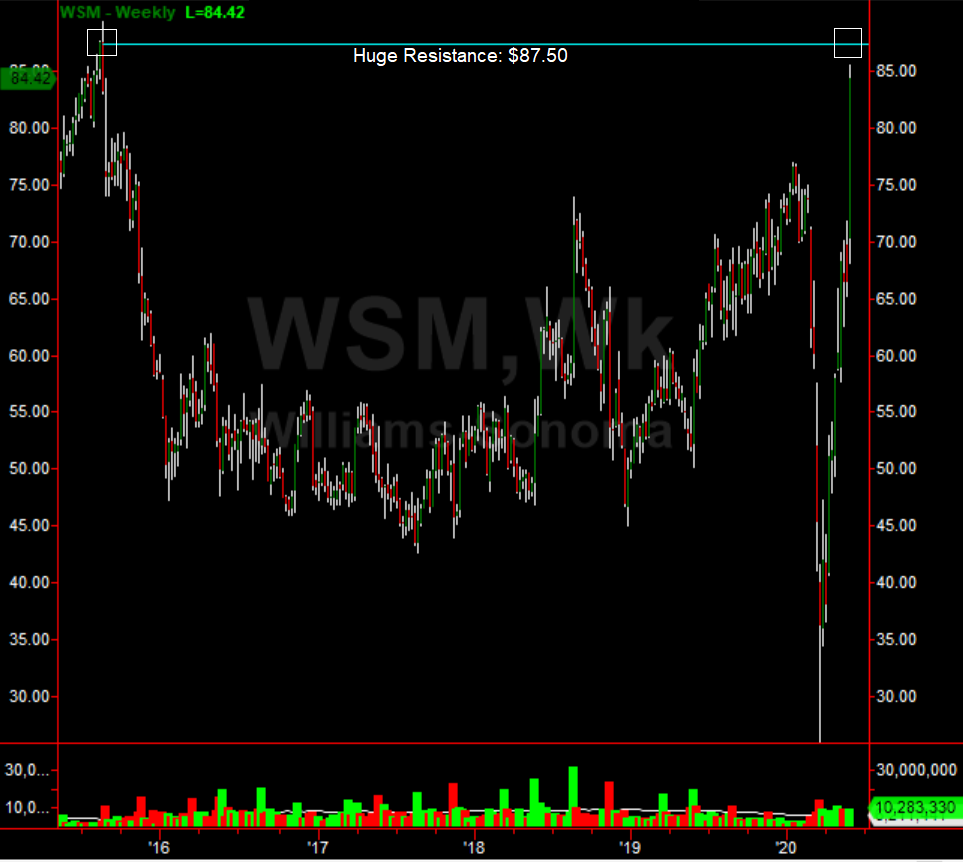
Shares of Williams-Sonoma (WSM) are soaring today on the back of solid earnings. The do-it-yourself cycle of the quarantine is playing out but based on the chart will not last. There is a strong stock chart sell signal on Williams-Sonoma at $87.40. The current price is approaching quickly. This is a classic former all-time high from 2015 that is now a major double top when prices hits it. In addition, the insanity of the move on Williams-Sonoma is clear when looking at the chart. Williams-Sonoma has rallied from $26 in March 2020, to almost $86 today. That is absolutely insane. Every technical metric slammed into extreme overbought signals today. The stock chart sell signal is strong and will cause Williams-Sonoma to collapse back to close to $75 in the coming days/week or two.
A net gain of +978.83% through May 29th, 2020 is a reality for members of Verified Investing Alerts. For investors who want to maximize profits to an insane degree during the COVID-19 pandemic, swing trading technical chart setups using the PPT Methodology is easy and profitable. Swing trading using these methods allows smart investors to jump in at key levels and out for 10%+ gains in days. Master Trader Gareth Soloway has guided his members, actively swing trading stocks, using key technical levels for multiple profits of 10% almost every day (yesterday 3 winners of over 10% each). With the action in the equity markets, members are getting multiple trades a day (on average). See the VERIFIED track record HERE (scroll down on the page). Gareth consults for hedge funds but still helps average investors swing trade. Members get exact entry prices, stops, targets and daily videos that analyze the market, stock and current positions. The second Master Trader Gareth Soloway buys/sells a stock, members get a text/email alert to get them in/out of the trade in seconds. See how this trade based a Technical Analysis Double Top makes money! See the stock chart sell signal on Williams-Sonoma below.
About the Author
Chief Market Strategist Gareth Soloway has been an avid swing and day trader since his days at Binghamton University where he studied Economics. After college, Gareth quickly excelled as a financial adviser but his heart was always in swing and day trading. He had this long standing belief that he could help investors make more money by advising them on shorter term investments (holding a stock for days to weeks) than the buy and hold crowd who lost 50% of their money during every market collapse. “Why not profit during the bear markets just like the bull markets”, he said. While helping others gain financial independence during the day, he spent his nights studying charts and price action, developing a unique market trading system that put his profits on a rocket ship. Some nights he would barely sleep when he found a new technique that was proven, once back-tested.