Technical Stock Chart Analysis: Alphabet (GOOGL)
By Fri, May 29, 2020
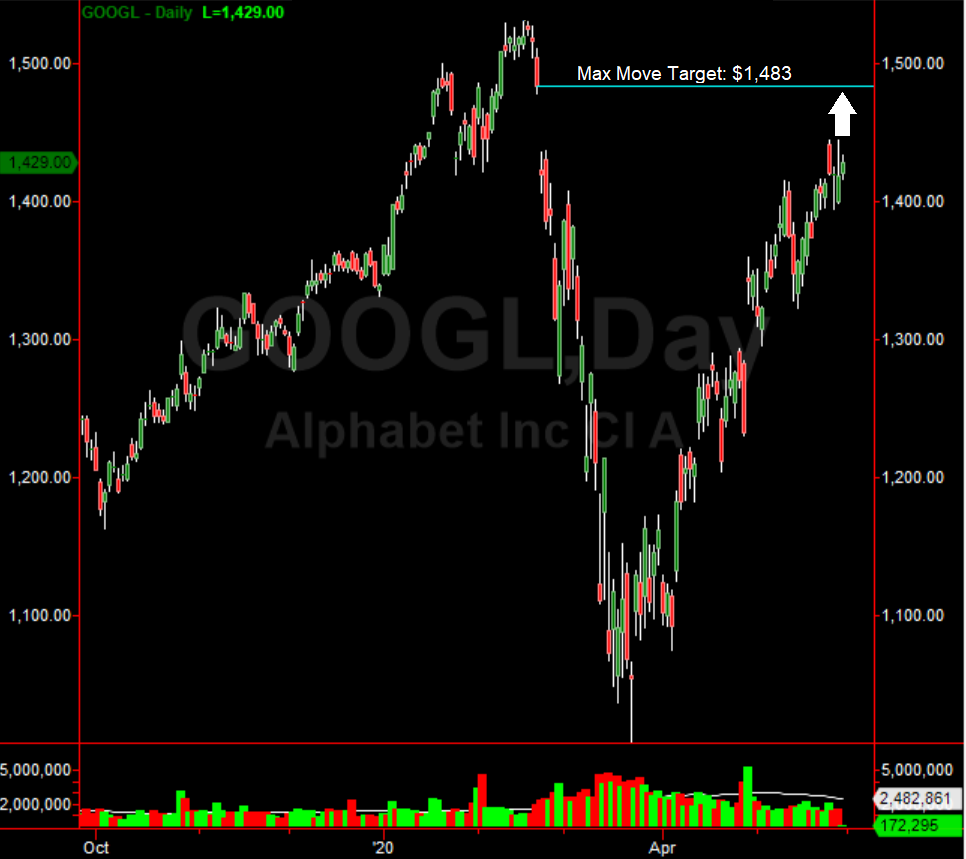
Shares of Alphabet Inc (GOOGL) continue to grind higher, having rallied from near $1,000 in late March 2020, to the current $1,429.00. Investors and swing traders are wondering where the technical stock chart analysis will take the stock before it becomes a sell or short. The answer to that is $1,483.00. There is a significant gap fill at this level, representing major resistance. In addition, the RSI (relative strength index) is nearing the overbought level of 70 but not quite there. This continues to signal a little more upside on Alphabet before it tops out.
The swing trade is simple here. Technical stock chart analysis says short Alphabet Inc at $1,483. A corrective move (drop) of more than 10% is expected based on the almost 500 rally in Alphabet. In other intriguing news, it was announced today that Alphabet Inc is rescinding offers for part-time contractors they were set to hire. This tells the smart investors and swing traders that Alphabet is seeing a major slowing in demand for their advertising services as well as other products. This will likely be part of the sell off factor once the upside target is tagged.
A net gain of +978.83% through May 29th, 2020 is a reality for members of Verified Investing Alerts. For investors who want to maximize profits to an insane degree during the COVID-19 pandemic, swing trading technical chart setups using the PPT Methodology is easy and profitable. Swing trading using these methods allows smart investors to jump in at key levels and out for 10%+ gains in days. Master Trader Gareth Soloway has guided his members, actively swing trading stocks, using key technical levels for multiple profits of 10% almost every day (yesterday 3 winners of over 10% each). With the action in the equity markets, members are getting multiple trades a day (on average). See the VERIFIED track record HERE (scroll down on the page). Gareth consults for hedge funds but still helps average investors swing trade. Members get exact entry prices, stops, targets and daily videos that analyze the market, stock and current positions. The second Master Trader Gareth Soloway buys/sells a stock, members get a text/email alert to get them in/out of the trade in seconds. See how this trade based a Technical Analysis Double Top makes money! See the technical stock chart analysis Alphabet Inc (GOOGL) below.
About the Author
Chief Market Strategist Gareth Soloway has been an avid swing and day trader since his days at Binghamton University where he studied Economics. After college, Gareth quickly excelled as a financial adviser but his heart was always in swing and day trading. He had this long standing belief that he could help investors make more money by advising them on shorter term investments (holding a stock for days to weeks) than the buy and hold crowd who lost 50% of their money during every market collapse. “Why not profit during the bear markets just like the bull markets”, he said. While helping others gain financial independence during the day, he spent his nights studying charts and price action, developing a unique market trading system that put his profits on a rocket ship. Some nights he would barely sleep when he found a new technique that was proven, once back-tested.